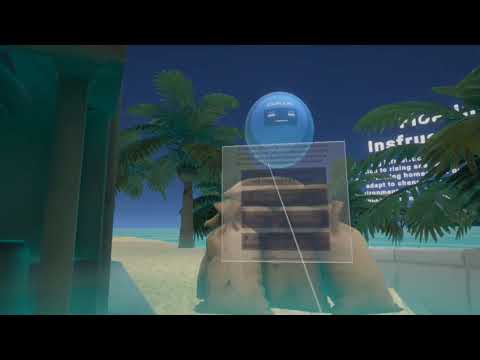
Watch the full application walkthrough: Climate VR Simulation on YouTube
Four climate hotspots. One AI guide. A collaborative lab floating above Earth. Here’s how we built it.
The Brief That Arrived From Kuwait
It started with a curriculum problem.
A professor at Kuwait University was teaching Grade 9 students about climate change. She had the slides. She had the readings. She had the videos.
But she had a bigger problem — none of it was working.
Students weren’t connecting. Climate change felt distant. Abstract. Something happening somewhere else, to someone else. The emotional gap between a teenager sitting in a classroom in Kuwait and a melting glacier in the Arctic is enormous. Standard teaching tools weren’t closing it.
She needed something that put students inside the crisis.
That’s where we came in.
What the Project Had to Do
The brief was ambitious. A fully immersive VR simulation for Grade 9 students. Four global “hotspots” — each with its own environment, interactive elements, local voices, and checkpoint assessments. A robot AI guide named GAIA who travels with students the entire time. A collaborative final lab where groups of students design a real climate action plan together. And a teacher dashboard so the professor could see everything that happened — notes, scores, decisions — after every session.
It had to run on VR headsets. It had to prevent motion sickness. It had to feel like a world, not a lesson.
And it had to be curriculum-aligned — built around global competence frameworks used in IB, Cambridge, and forward-thinking national curricula.
Simple to say. Genuinely hard to build.
Why VR and Not Just a Good Video?
This is the first question every administrator asks.
Here’s the honest answer: video makes you a spectator. VR makes you a participant. The research on this is increasingly clear — when students are placed inside an environment rather than watching it through a screen, retention improves, empathy increases, and complex systems become intuitive rather than abstract.
For climate education, that distinction is everything.
You can tell a student that Arctic sea ice has shrunk dramatically since 1980. Or you can put them on the ice, hand them a timeline slider, and let them watch it disappear in real time with cracking sounds around them.
One of those experiences changes how a person thinks. The other gets forgotten by Thursday.
The World We Built
GAIA: The Guide Who Lives Inside the Simulation
Before I talk about the four modules, I need to talk about GAIA.
GAIA — Global AI Assistant — is a small hovering robot with an animated face screen and a soft glow. She floats beside each student for the entire experience. She’s the emotional anchor of the simulation.
I spent a significant amount of time on GAIA’s scripts. The tone had to be warm but never condescending. Something that works for a 14-year-old in Kuwait or Jakarta or London. She had to feel like a companion, not a textbook narrator.
The name was intentional. GAIA — the Greek personification of Earth. A guide who belongs to the planet, not to any one culture or country.
Every student also has a virtual tablet attached to their left wrist with four tabs — Notes, Checkpoint, Map, Evidence. This is how the assessment system lives invisibly inside the world without ever feeling like a test.
Module 1 — Arctic: Melting Ice & Rising Seas
Students arrive on broken sea ice. The sky is low. The wind howls. The ice cracks.
Four interactive elements anchor this module:
Ice Core Station — a holographic cylinder showing ancient air bubbles trapped in ice layers. CO₂ levels are visible decade by decade. The line jumps upward in recent years. Students see the data — not as a chart in a textbook, but as a physical object they’re standing next to.
Satellite Timeline — a slider from 1980 to 2024. Students drag it themselves and watch white sea ice shrink across the Arctic. The visual is more convincing than any statistic.
Temperature Slider — drag from +0°C to +4°C. Watch ice thickness decrease. Watch the sea level gauge rise. At +2°C, the overlays start showing flood risk indicators. Students feel the relationship between the number and the consequence.
Inuit Voice Node — a glowing icon. Tap it. An Inuit community member speaks — not about data, but about unsafe ice, disrupted hunting routes, seasons that no longer behave the way they should. This is the moment students stop treating the Arctic as a science topic.
Module 2 — Maldives: Sinking Shores & Adaptation
The Maldives is a nation of islands averaging less than two meters above sea level. A moderate sea level rise doesn’t flood a beach — it erases a country.
Students stand in a coastal village and watch water slowly rise around the houses. Then they face a real decision: what should the Maldives do?
The Adaptation Gallery presents four options — Relocation, Sea Walls, Floating Infrastructure, Coral Reef Conservation — each as a 3D model with detailed pros and cons panels.
There’s no clean answer. That’s deliberate. Students have to weigh effectiveness against cost, against cultural loss, against environmental impact. Before they decide, a Maldivian resident’s voice plays. She doesn’t describe statistics. She describes fear — the fear of losing a home her family has lived in for generations, and whether leaving counts as survival or erasure.
Module 3 — Amazon: Deforestation & the Planet’s Lungs
The Amazon module opens beautifully. Dense canopy. Birds. Animals visible through the trees. Then students walk forward along a path.
The forest thins. Stumps appear. Smoke haze fills the air. The transition is gradual. That’s what makes it devastating.
Tree Ring Station — hover over a cut trunk. Age rings appear with carbon storage data. Older trees store more. When they burn, that carbon enters the atmosphere. Students see this relationship in three dimensions.
Before/After Satellite Slider — lush green on one side, grey cleared land on the other. One drag of a slider.
Reforestation Sandbox — students plant saplings in an interactive patch and see projected recovery timelines. This is the module’s small moment of hope. It matters.
The key insight the module builds: deforestation in South America changes rainfall patterns and temperatures on other continents. The Amazon isn’t Brazil’s problem. It belongs to everyone.
Module 4 — Australia: Wildfires & Land Stewardship
The Australia module starts healthy. Eucalyptus forest, birds, insects, green.
Then a time-lapse. The vegetation browns. Dries. Catches fire. Students watch from a safe distance as flames move through the forest — fast, in ways that make the risk map suddenly very real.
Two voices anchor this module. A firefighter explaining how quickly modern wildfires move through dry vegetation and how difficult they’ve become to control. Then an Indigenous Australian elder explaining traditional controlled burning — a land stewardship practice used for thousands of years that modern fire management is only now beginning to take seriously.
Students then choose prevention measures from the Mitigation Strategy Table and run a simulation. One of the options is deliberately “Do nothing” — so they see that outcome too.
The Global Climate Action Lab
After completing all four modules, students unlock the Global Climate Action Lab.
This is the most ambitious part of the build — and the one I’m most proud of.
Two to four students appear as avatars around a shared holographic table floating above Earth. Four large windows around the room show the regions they’ve just visited. An Evidence Library lines the walls, filled with digital cards from every module — “Arctic: Ice melt → sea-level rise”, “Maldives: Cultural loss from relocation”, “Amazon: Global carbon absorption”, “Australia: Indigenous land management.”
Their task: design a global climate action plan together.
Step 1 — Priority Problems. Pull cards from the library. Agree on the two most urgent problems. Every student must agree before the experience advances.
Step 2 — Choose Actions. Select three actions — local or global, mitigation or adaptation. GAIA pushes them to balance both.
Step 3 — Link Evidence. Every action needs evidence cards attached. Opinions without data don’t count.
Step 4 — Group Voting Dials. Three dials, 0–10, set as a group:
- Climate Effectiveness — does this plan actually reduce risk?
- Social Fairness — is it fair to vulnerable communities?
- Environmental Protection — does it protect ecosystems?
The tension between those three dials is where the real learning happens. A plan that scores 10 on effectiveness might score 3 on fairness. Students sit with that. They argue. They compromise. That’s the point.
The Teacher Dashboard
The most important thing we built wasn’t visible to students at all.
After every session, the professor could open the Teacher Dashboard and see:
- Every note each student took, organized by module
- Checkpoint responses and scores across the full class
- The group’s final lab decisions — priority problems, actions chosen, evidence linked, dial values
- Individual written reflections
A 45-minute VR session produces more formative assessment data than a week of traditional worksheets. That’s not a marketing claim — it’s what the architecture makes possible when assessment is built into the world rather than bolted on afterward.
VR in education lives or dies on whether teachers can actually use it in their workflow. We built the dashboard as a first-class feature.
What This Project Taught Me
1. Teleport-only locomotion isn’t a compromise — it’s the right call
Free locomotion in educational VR causes motion sickness in enough students to derail an entire session. We used teleport throughout. It feels slightly less cinematic. It works every time.
2. Voice carries more weight than visuals
The Inuit community member. The Maldivian resident. The Indigenous Australian elder. We expected these moments to land emotionally. What surprised me was how much the writing mattered — not production quality, but whether the words felt like a real person speaking from a real life.
3. Collaboration mechanics need guardrails
Open collaboration in VR without structure becomes chaos quickly. The consensus system — where all students must press “Ready” before advancing — was added after testing. It’s a small mechanic. It completely changes the group dynamic.
4. Assessment that feels invisible is assessment that works
Every checkpoint, every note, every dial value feeds the teacher dashboard — but students experience it as part of the world. They’re not taking a test. They’re exploring. That distinction is worth all the extra architecture it requires.
The Result
A fully deployed immersive VR climate education experience — four global regions, an AI guide, collaborative decision mechanics, formative assessment, and a teacher dashboard — delivered and deployed at Kuwait University.
More than that: a product that changed how students talked about climate change. Not as a distant, abstract crisis — but as something happening to real people, in real places, right now.
Thinking About a Similar Project?
If you’re building a simulation, immersive training system, or educational VR experience, you need a team that understands:
🔹 Curriculum alignment — technology that serves pedagogy, not the other way around
🔹 Collaborative real-time mechanics — multi-user VR without the chaos
🔹 Assessment architecture — invisible to students, powerful for educators
🔹 Field-tested deployment — built to survive real classrooms and real users
This product is also available for licensing — customizable for your curriculum, your students, your institution’s branding. International schools, universities, education ministries, EdTech platforms — if this fits your program, let’s talk.
The fastest way to reach me is directly.
📩 sayedsulaiman607@gmail.com · cto@witshells.com
💬 WhatsApp Me →
Tags: VR Education, Climate Change VR, Immersive Learning, EdTech, Unity 3D, Global Citizenship Education, Educational Simulation, Middle East EdTech, Kuwait University, Collaborative VR
About the Author
Syed Suleman Shah is CTO of WitShells Studio — a VR and interactive experience studio delivering immersive environments for education, defense, and enterprise clients across Pakistan and the Middle East.
© 2026 WitShells Studio (SMC-Private) Limited. All rights reserved.